Create Dashboard
Dashboards offer a clear and comprehensive overview of project elements at various levels of abstraction, be it the contents of a package, organizations or even entire projects. Dashboards are easy to modify to your specific needs and can be adjusted at any time.
Create Dashboard
Dashboards display data in tiles. A dashboard is capable of displaying 5 tiles in a row; underneath are stored the additional tiles.
- In the context menu of a package, execute the command Create other/ Dashboard.
- Name the dashboard and enter a header. The header should be a short description of the dashboard’s theme.
- After having given the dashboard a name and header, select the option for Open in the bottom left corner of the dialog and click OK.The blank dashboard will open in the centre of your screen.
Create content
To create content for the blank dashboard, you first need to create a group. When creating a group you will have to specify the properties such as the size of the charts, key figures corresponding queries. You can also provide the group with a name.
- To create a new group, click on the green Plus button in the right-hand corner of the dashboard view.
- In the dropdown menu, specify the size in which the elements should be displayed. You can change this size at anytime.
- In the field that appears in the dashboard view, click on the green Plus button displayed in the centre of the newly created field. You will have the option between creating either an indicator (displaying key figures), a chart (pie chart), or a view (for views or queries).
- Enter the context element, view or query which the indicator, chart or view should display.
- Confirm you choices and create further content.
Edit tiles
In the top-right corner of the dashboard view is a button with three lateral lines. This activates and deactivates the Edit mode, which let’s you edit and delete the dashboard tiles.
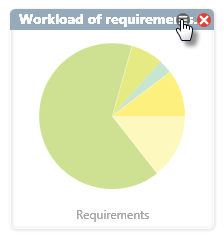
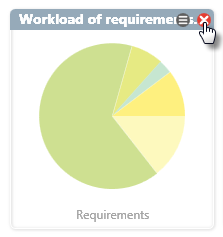
Every dashboard tile also has its own button for enabling the Edit mode. In the editing dialog, you can change the chart kind, tile name, stereotype, context element, etc.
Whilst the editing mode is activated, you will be able to create new tiles for a group in the grey area that appears in each group’s section of the view. Click on the green Plus button to create a new group tile.
Refresh dashboard
When you open a dashboard, it will always be up to date with any changes made to its contents. If you make any changes to the elements displayed on the dashboard whilst the dashboard itself is still open, simply press F5 to refresh the view.
If a dashboard has a large number of tiles, you can run the task Calculate performance indicators, which will save you from having to wait a long time for the view to refresh.
Delete dashboard
Delete a dashboard by finding its entry in the package directory its stored, opening its context menu and executing the Delete command. If the dashboard is accessible through the theme bar, you can also delete it there directly.


