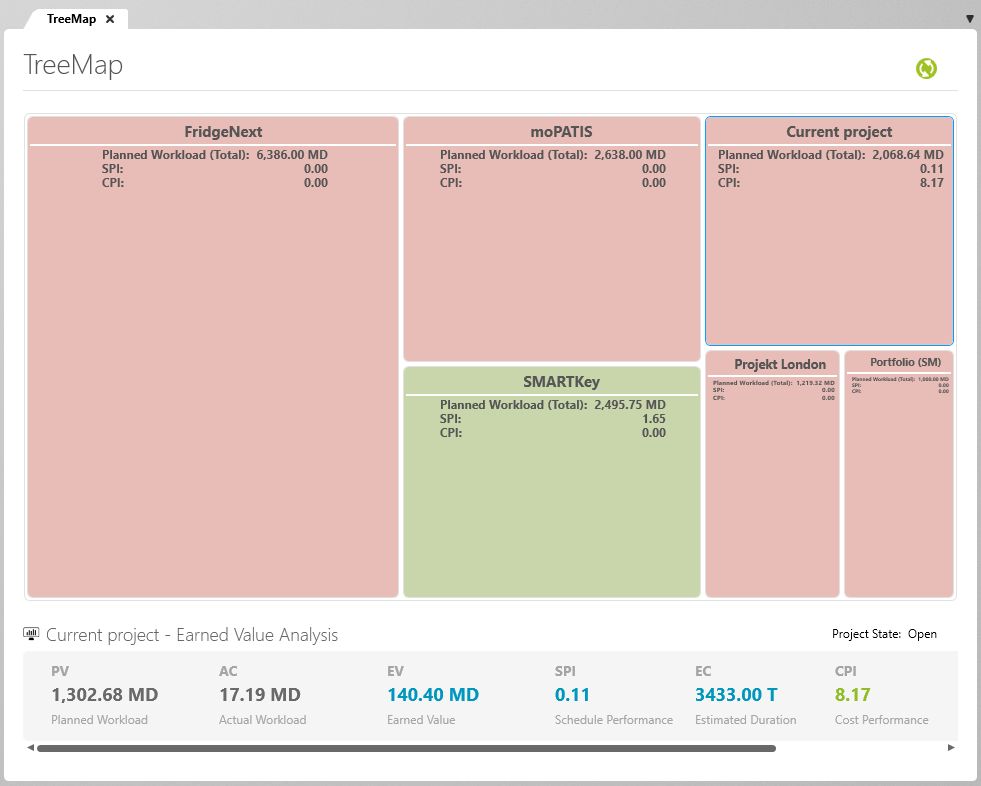
View for ‘Earned Value Treemap’
In this view, you gain a general overview of the value streams from a selected portfolio, which reveals its current progress (differentiated by colour) and value (shown by size).
Open the view
- By selecting Open in the context menu, or
- With a double-click.
The View
The porfolio’s value streams are displayed as rectangles. The larger the rectangle, the more cost-intensive and important the value stream. The colours (blue, green, red) can be used to signify whether or not the value streams are running according to plan.
- Green = Running according to plan.
- Red = Not running according to plan.
- Blue = Project is still in its planning phase and therefore can’t be assessed.
The two gradations that can be applied to the green and red rectangles symbolize how close the calculated values are to the statuses the colours represent. If you configure the view and change the colour properties, the treemap will be recalculated and the colour values adjusted accordingly.
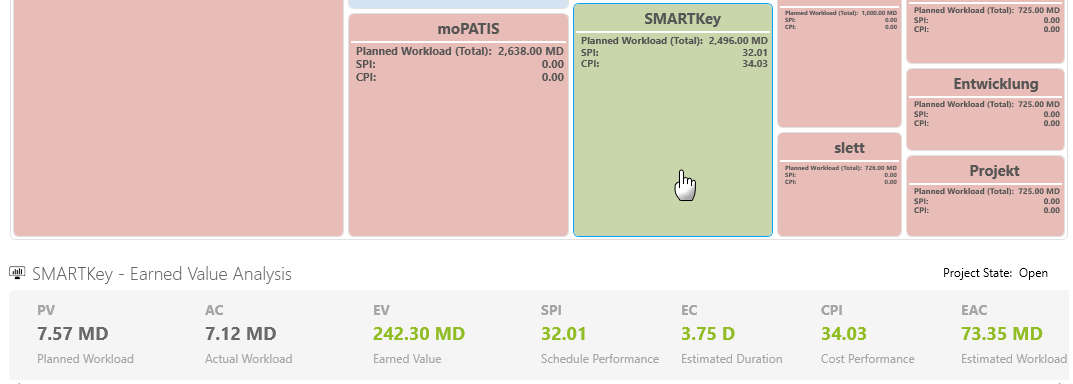
In the lower section, you will see the values of the Earned Value Analysis and the status of the currently selected value stream. Here, all you need to do is click on a rectangle.


