View for ‘Time Recording Report’
In the view for Time recording report, it’s possible to see reports of the working hours that project members have recorded for specific projects. By default, every user can access this view as long as the option Allow reporting of time recording for all projects is enabled in the general settings of the user in question. In the case that a senior project member wishes to view and also evaluate the time reports of their colleagues, the option View time recording report of other team members must be enabled in the senior project member’s user properties.
Open the view in a project:
- with a double-click,
- or by selecting Open in the context menu of the view.
The view
In the view, you have the following options:
Time range from/ to Here, you choose a start and end date for the time period you want to view. To do this, either manually type in the date or choose a date from the calendar in the drop down menu.
Time scale
In this section, choose a time interval from the drop down menu. This determines the level of abstraction in which the time report is displayed. The available intervals are daily, weekly, monthly, quarterly or annually. It’s also possible to see the entire amount of working hours that have been recorded by a project member.
Layout of the view
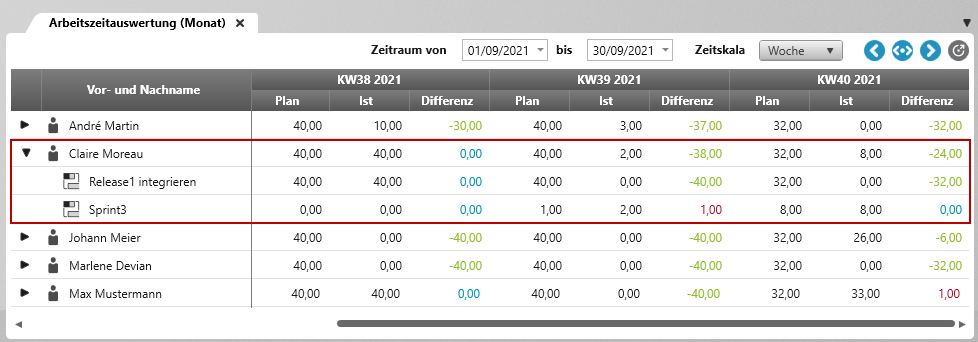
The section of the left-hand side lists the staff members working on a given project. When configured, it can also list other categories, such as usernames. To view the activities assigned to each listed project member for the time range that has been entered, click on the arrow to the left of their names. The activities appear below.
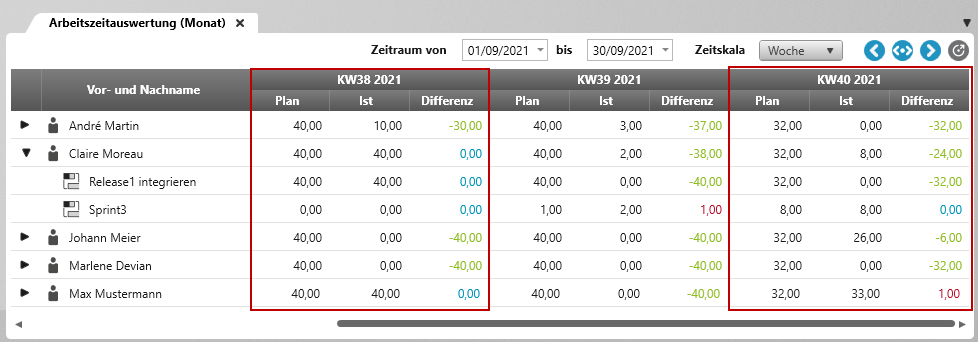
When viewing the time recording reports, it’s helpful to have all three columns for Planned working time, Actual working time and Working time- difference open. This will give you an overview of how planned working hours match up to actual time worked.
The planned working hours and actual hours worked are displayed in Black.
Conversely, values in the column for Working time- difference are highlighted in either green, blue or red. This makes it easier to spot any deviations from the planned working hours:
Green values signify that planned working hours haven’t (yet) been reached.
Blue values signify that planned working hours and time actually worked are identical; only a value of 0 can be blue.
Red values signify that a project member has worked overtime.


