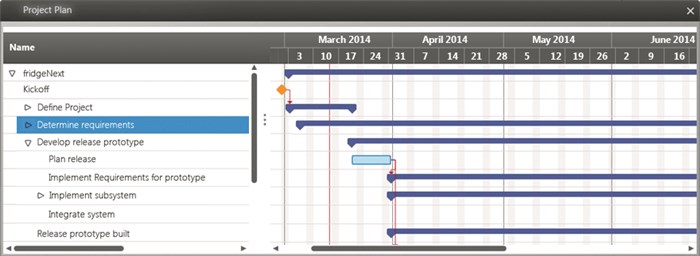
View “Activity plan as Gantt chart”
The view is a project flowchart in which you are presented with all project activities or only one activity with its child activities. The view is suitable if you want to concentrate on a particular part of the project, for example.
A project plan is initially contained in the project template.
The view can be opened:
- in the Products window under Analyses/ Views/ Activity Plan as Gantt Chart
The view
| Fit to time range displays an input window in which you can enter a time period. The view displays the set period when you confirm the entry with the blue arrow button. | |
| Start of selected activity jumps to the beginning of the selected activity. | |
| Now Jumps to the current timeline (current date). | |
| End of selected activity jumps to the end of the selected activity. | |
| Reschedule all activities The project plan is recalculated after changes. | |
| Exportieren saves the project plan as pdf or xps. |
The following icons are used:
| |
Dark blue bars visualize complex activities – ones that contain sub-activities. Blue bars indicate complex activities consisting of one or (in most cases) several subordinate activities. Their duration is matched to the start/end dates of the subordinate activities or milestones. |
| |
This is a fixed collective activity whose subordinate activities are contained within the collective activitiy. |
| |
This is a collective activity whose subordinate activities fall outside of the calculation. |
| |
Light blue bars indicate activities that have not been allocated to requirements yet. You can change the position with the mouse as well as the duration (indicated by the length of the bars). |
| |
The filling of the bars visualizes the progress. You can adjust the values using the mouse. |
| |
The workload of all the planned requirements belongs to the fixed workload of the activity. |
| |
The workload of the planned requirements is just as high as the workload of the activity. |
| |
The workload of the planned requirements exceeds the fixed workload of the activity. |
| |
Little squares indicate milestones (gates) in the project. They can be shifted in the calendar using the mouse. |
| |
Control flows indicate connections between activities. |
Create View
You create the view from the context menu of a package using the Create other/ View command. Under Type, choose Activity plan. Then define the columns that are to be displayed in the view. To do this, click on the plus button to show other columns in addition to the name.