The Roadmap
In the roadmap, you see all milestones (of type Gate) that are planned for the specified period in the organization’s projects. The milestones are indicated by blue dots on the time axis. If milestones are so close together that there is only enough space to display information for a milestone, they are only displayed for the milestone that belongs to the point displayed in blue. Further milestones are visualized by a grey dot.
The view you find in an organisation:
- in the Organization window, when you open the Information/ about projects package.
Only activities of type Gate are displayed in the Roadmap.
The dialog
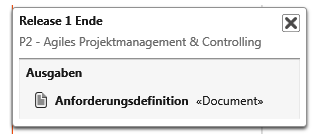
The roadmap provides an overview of when and which milestones are to be reached in the individual projects according to planning. For example, you can display the expected results for each milestone by clicking the Show details button. Instead, click on the blue button with the double arrow to jump directly to the project that belongs to the milestone.
Decrease/increase period
You can define the time period to be taken into account in the roadmap using the slider at the bottom. Shorten or lengthen the section by moving the handles to the left or right while holding down the mouse button.

Move period
Click on the slider and move the entire section on the timeline while holding down the mouse button.

Show information
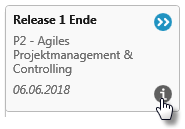
Click the i icon to display the input/output.