Dialog “Edit Chart”
Charts can make up multiple components of a dashboard.
The dialog can be opened:
- Open a dashboard. Activate the editing mode of the dashboard and then click the Plus button within a group. Choose Create new Chart.
The dialog
Chart kind You can use the drop down menu to determine a diagram type:
- Requirements by state
- Burn-Up
- Burn-Down
- Culmulative Flow Diagram
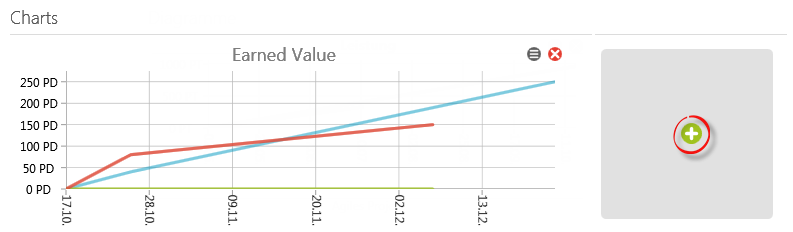
- Earned value analysis
- Performance
- Project resource workload
- Velocity
Name The name of the diagram type will be set in here by default. You can change this name.
Context element Enter the activity or a view that should be evaluated using the […] button.
Note
To add the views Staff Workload or Cumulative Flow Diagram, please make sure that these views have already been created.
To add the views Staff Workload or Cumulative Flow Diagram, please make sure that these views have already been created.
Show axis You can hide or show the names of the y and x axis using this control box. It is checked by default.
Save and create a new Element Mark this checkbox if you want to add multiple indicators after one another diagrams can make up multiple components of a dashboard.