The Dashboard
In organisations and projects, you can create dashboards. Dashboards present an overview of information and are configurable. You can use dashboards in organizations to provide an overview of employee workloads in your project. Dashboards in a project are very useful, especially when you would like to compare the progress of different teams or sprints, for example.
Create dashboard
The information in the dashboard is displayed in multiple boxes, depending on what you want it to display. You can place multiple boxes on the dashboard. A maximum of five boxes are placed next to each other, with each box below.
- From the context menu of a package, call the command Create other/ Dashboard.
- Name the dashboard and enter a subheading in the field Header.
- Select the Open option at the bottom left and click OK.
The dashboard is created and opens in the center of the screen.
Create content
To view content in a dashboard, you must create at least one group. You use a group to specify how large the charts, key figures, or queries should be displayed within the group. You can also give the group a name, which is displayed above the content.
- Click the Plus button to define an area or group.
- Use the drop-down menu to specify the size of each item. You can change the size at any time.
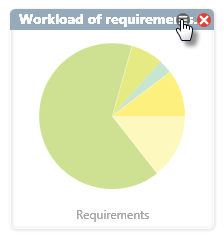
- Click on the Plus button in the middle and select what you want to create by clicking on it. You can choose between indicators (key indicator), diagrams (graphical diagrams, charts) and views (views and queries).
- Depending on what you have selected here, you enter a context element or a view.
Confirm the dialog and create further areas and elements.
Open dashboard
To open dashboards, use the Show command in the context menu or double-click a dashboard.

Edit tile
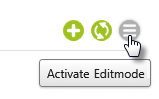
If you want to show, edit or delete more key figures, activate the edit mode of the dashboard by clicking the Activate editmode button at the top right.
Each key figure and each diagram has its own edit button. Click the button to change the name of the indicator, the indicator type, and the context activity.
If you want to create additional key figures or charts, click on the Activate Editmode button at the top right. A plus button appears in the Key Performance Indicators and Chart areas, which you can use to add further elements to the relevant area.
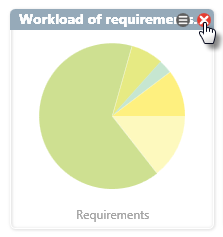
Delete elements
The information in the dashboard is displayed in multiple boxes, depending on what you want it to display. You can place multiple boxes on the dashboard. A maximum of five boxes are placed next to each other, with each box below.
Refresh dashboard
Dashboards always show the current status when opened. If the view is open for a longer period of time while the project is still being worked on, you can update the view with F5. If the dashboard contains a lot of tiles, use the task Calculate KPI otherwise opening and recalculating may take some time.
Delete dashboard
You delete a dashboard by selecting the dashboard in the Products window and using the context menu command Delete. If it has been added to the topic bar, you can also delete it from there.