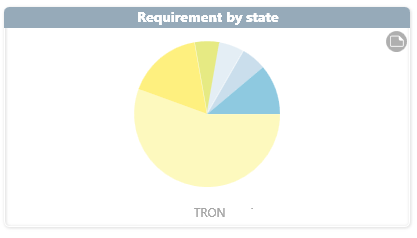
Diagram “Element by state”
The Elements by state diagram shows you the individual states of all elements of a type that are in a package or activity. No partial requirements (refinements) are taken into account if, for example, you have selected requirements as stereotypes. If you want to display requirements, we recommend that you use this diagram type, since the refinements are also taken into account here.
You create the analysis in the dashboard
- within a group by clicking on the plus button, selecting Create new Chart and selecting Elements by state in the subsequent dialog under Chart kind.

