Diagram “Velocity”
Use this graph to determine the average processing speed of an activity. Use the diagram to analyze the performance of a team at the beginning of a project, for example, to decide whether more employees are needed, the sprint length must be adjusted, or the average effort of an activity must be reduced or increased. The average speed is calculated:
Average velocity = Sum of the efforts of all previous sprints / number of sprints
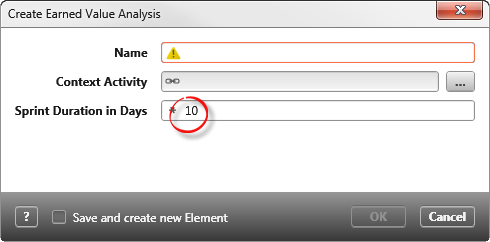
You create the analysis in the dashboard
- within a group by clicking on the plus button, selecting Create new Chart and selecting Velocity in the subsequent dialog under Chart kind.
The y-axis shows the effort of the activity and the x-axis shows the set duration of the activity. Using the blue lines, you can determine in which time and how much of the assigned requirements are implemented within the sprint.
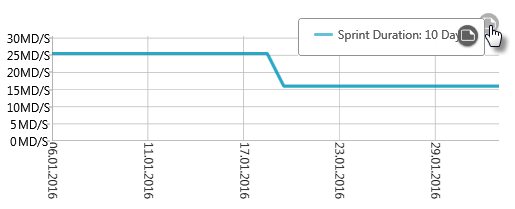
You have a sprint duration of 10 days (2 weeks) with an expenditure of 30 PT per sprint. In the first sprint, requirements were met with a total effort of 25 PT. The average speed is therefore 25 PT per sprint. In the second sprint the achieved value is only 5 PT. As a result, the average speed dropped to 15 PT after two sprints.