Additional views
You can use network plans, Earned Value Analyses, Cumulative Flow Diagrams or dashboards to evaluate activities.
Dashboards
For communication with management, decision-relevant information and current key figures are required at various planning levels – for example, for an entire project or a single release. To be able to draw conclusions about the status and progress of the work, we recommend that you compile the desired information and key figures in dashboards. The dashboards then show you at a glance, but from different perspectives, how your project “is doing”.

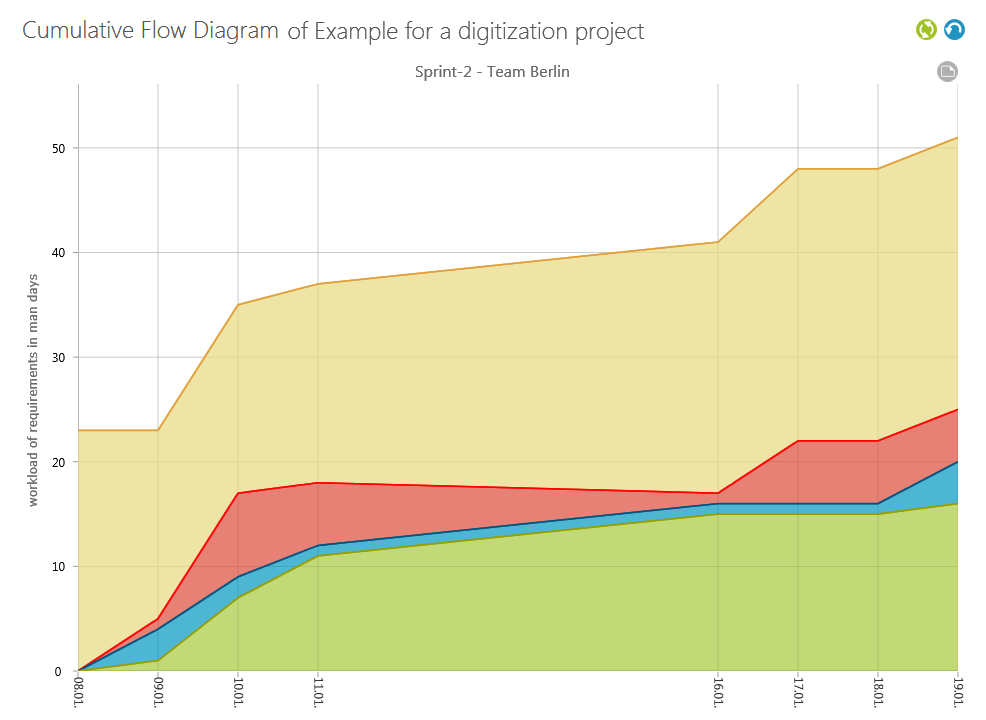
Cumulative Flow Diagram
In addition to the dashboard, the Cumulative Flow Diagram is another view that gives you a quick overview of the processing status of your requirements.
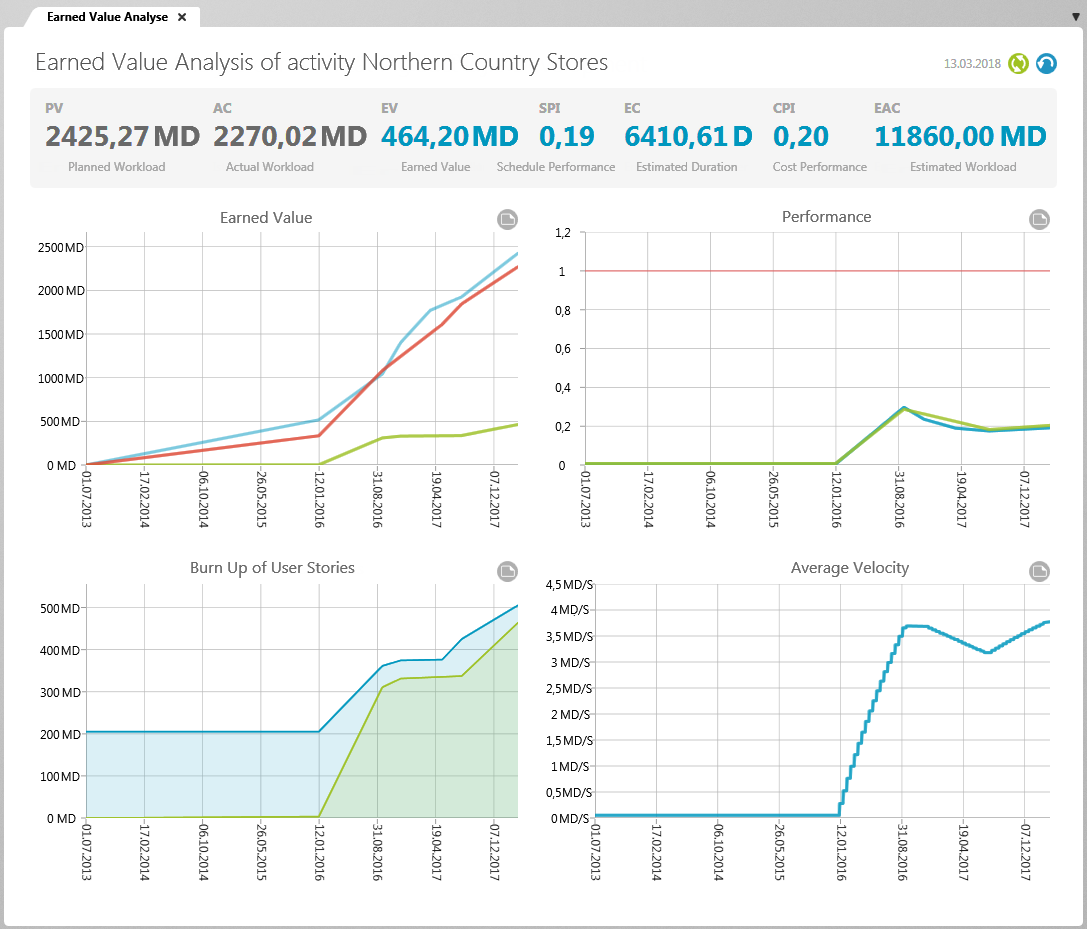
Earned Value Analysis
Earned value analysis is a project controlling method in which the performance of a project or an individual activity is determined on the basis of project key figures. Plan costs, actual costs and earned value are used as key figures.
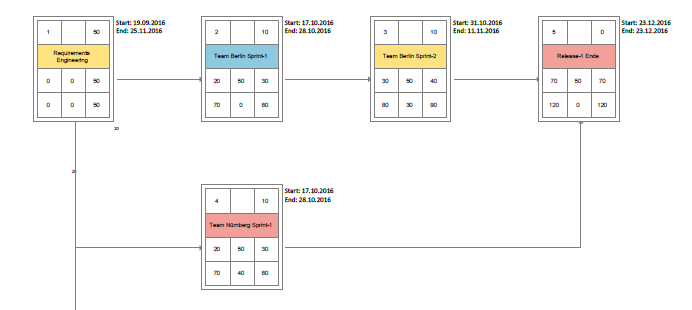
Precedence diagrams
The precedence diagram is a graphical representation of your project activities, represented abstractly by nodes. You can use the precedence diagram to see what time reserves you have and to what extent the project will be delayed if dependent activities take longer than expected.
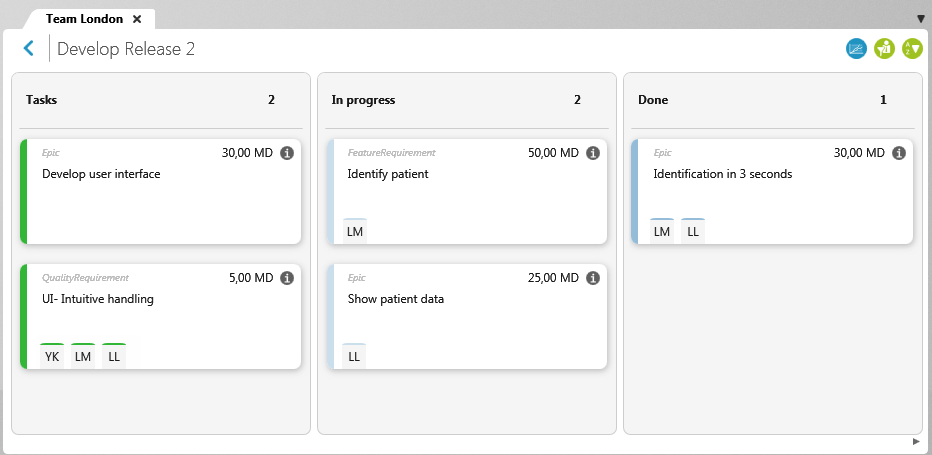
Kanban Boards
objectiF RPM offers you two types of views, which are based on the Kanban Board. With the help of the “Kanban Board for Activities”, you can see and organize all requirements which are assigned to a Sprint, Release or Team. The view is divided into columns that represent the states that the requirements go through until they are implemented. You can also create a kanban board which displays other project objects, such as test cases.