The precedence diagram
The precedence diagram is a graphical representation of activities that follow one another in time. The activities are represented by nodes, which in turn are linked by lines. The precedence diagram shows you which time reserves you have and to what extent the project will be delayed if dependent activities last longer than expected. The precedence diagram shows
- which activities are on the critical path,
- the duration of the activities,
- the buffer times.
Activities that do not influence the project plan are displayed below each other. This includes, for example, referenced activities from other projects.
Create precedence diagram
You can generate a precedence diagram at any time for an activity.
If you have referenced activities from other projects, update them using the UpdateActivity/ Activity Reference command.
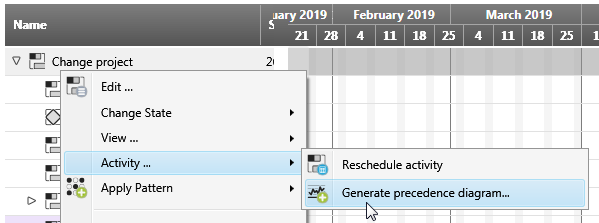
- Select an activity with subordinate activities and choose Activity/ Generate precedence diagram from the context menu.
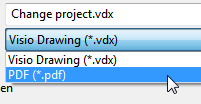
- Specify a save path and file format. You can choose between pdf and Visio.
- Click Save.
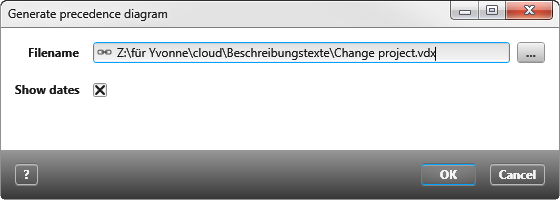
- In the following dialog you can use the option Show date to specify whether the start and end dates of the activities should be displayed in the precedence diagram.
- Click OK to save the precedence diagram.
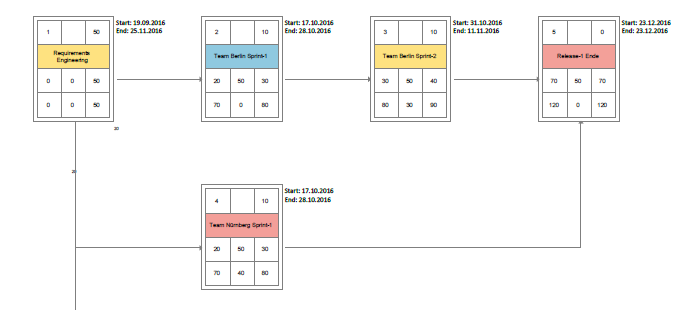
The activities are displayed as boxes. The legend of the document explains the meaning of the numbers in the boxes.
The precedence diagram
The node
Each node contains information on duration, earliest and latest start and end times, buffer times, and a number. In addition, each node has a colored frame that indicates the current status of the activity. (The colors are taken from the respective state icon.)
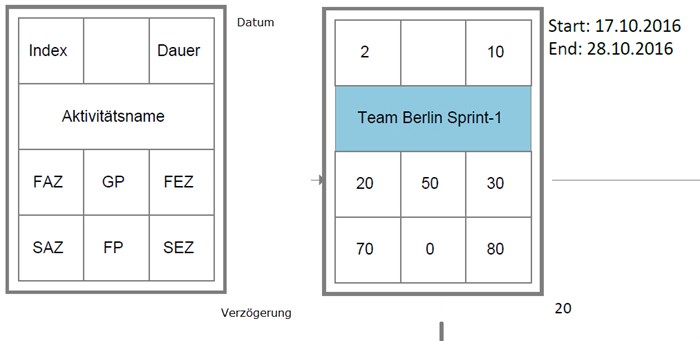
In the right node you can read the following: This is the second activity. It has a duration of ten days with a total buffer of 50 days. The activity starts on day 20 and ends with a duration of 10 days on day 30 at the earliest. With a buffer of 50 days, the activity starts on the 70th day at the latest – without postponing the end date – and thus ends on the 80th day.
Legend
| Index | Activity number |
| Duration | Duration of the activity in days. The duration is always rounded up in the node, whereby 1 day corresponds to 8 hours by default. The default value is preconfigured and depends on what is set under Working time per day in the project. This means: If the duration of an activity is 1 hour, the network will display a duration of 1 day. If the activity duration is 9 hours, the network will display 2 days. |
| FAZ | Specifies the earliest start time in days. |
| SAZ | Specifies the latest start time in days. The latest start time is calculated: SAZ = SEZ – Dauer. |
| FEZ | Specifies the earliest end time. The earliest end time is calculated: FEZ = FAZ + Dauer. |
| SEZ | Specifies the latest end time. |
| GP | The total buffer specifies how much an activity can be moved without moving the end time of the follow-up activity. If you consume the total buffer, the (earliest) start of the follow-up activity is shifted, but the end date of the project is not delayed. If you move an activity with a total buffer of 0, the end date of the project is also shifted back. The activity is on the critical path and the total buffer is calculated: GP = SEZ – FEZ |
| FP |
The free buffer specifies by how much an activity can be moved without moving the start time of the follow-up activity. If you have a free buffer available, you can move the activity backwards without affecting subsequent activities. The free buffer is calculated: FP = FAZ (follow-up activity) – FEZ (predecessor activity). When calculating the free buffer, an additional delay is taken into account if you have fixed parent activities in the project plan. This is the duration resulting from the inherited control flow of the father activity to the leaf activity. |
| Verzögerung (Delay) | Entered delay in the properties of a control flow. If there is no delay, nothing is displayed. |
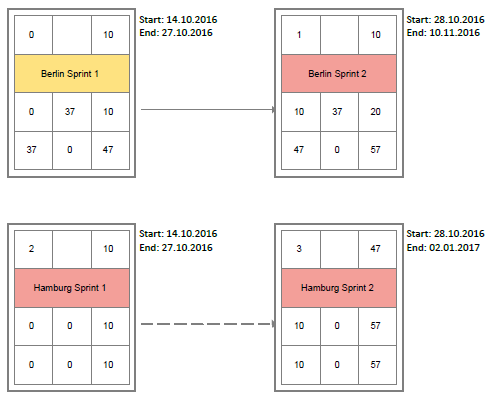
Critical path
The critical path connects the activities that can influence the end date of the project if the duration of these activities is delayed. Activities on the critical path always have a total buffer of 0. The critical path is represented in the network by a dashed line.
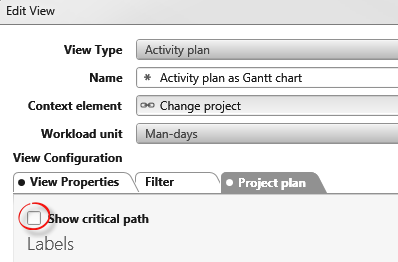
The critical path is also displayed in the project plan if you have selected the Show critical path option on the Project plan tab in the view.
Calculations
There are four control flows, each of which is calculated differently for the precedence diagram.
Control flow
start to start Predecessor and successor activities start simultaneously
earliest start of successor activity = earliest start of predecessor activity + delay
latest end of successor activity = latest start of predecessor activity – delay + duration of successor activity
end to start predecessor activity must be finished so that successor activity can start
earliest start of successor activity = earliest end of predecessor activity + delay
latest end of successor activity = latest start of predecessor activity – delay
start to end before the successor activity can begin, the predecessor activity must be completed; results in a negative buffer
earliest start of successor activity = earliest start of predecessor activity – delay – duration of successor activity
latest end of successor activity = latest end of the predecessor activity + delay + duration of the successor activity
End to end both activities end simultaneously
earliest start of successor activity = earliest end of predecessor activity + delay – duration of successor activity
latest end of successor activity = latest end of predecessor activity – delay