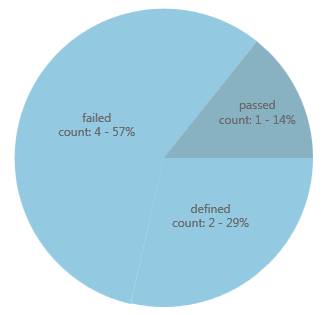
Diagram “Requirements by state”
The Requirements by state diagram shows you the state distribution of the individual requirements in a project, activity, or package. Not only the requirements themselves, but also their subrequirements (refinements) are taken into account. The refinements can be in a different package. If you have selected an activity to which a backlog is assigned as the context element, the system displays the assigned requirements, their refinements, and the requirements in the backlog in the diagram.
When you create the diagram, you can evaluate the number of requirements or the effort involved.
The chart shows all states defined in the state machine for the Requirement stereotype and the child stereotype. Each state is represented by the color of the state icon. This also applies if you have created your own state machine for the subordinate stereotypes, such as Epic, QualityRequirement, Constraint, and so on.
If you have defined different states with the same color, you will see the same color several times in the diagram.
If you have defined states with the same name but different state icons, you will see both colors in the diagram. Move the mouse over the legend or the colored area to see the states.
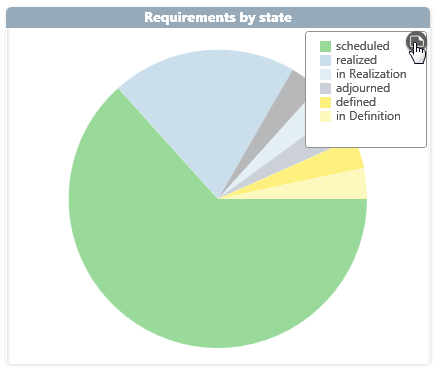
If the names and state icons are identical, the name and color defined in the state machine for the main stereotype are displayed.
You create the analysis in the dashboard
- within a group by clicking on the plus button, choosing Create new Chart and selecting diagram type Requirements by state in the subsequent dialog box.