Diagram “Earned value analyse”
The Earned Value analysis displays the earned value of the selected activity. The planned expense (blue line), the actual expense (red line) and the earned value (green line) of an activity are displayed. This enables you to see whether you are in the time and cost plan.
You create the evaluation in the dashboard
- within a group by clicking on the plus button, choosing Create new Chart and selecting Earned value analysis under Chart kind in the subsequent dialog.
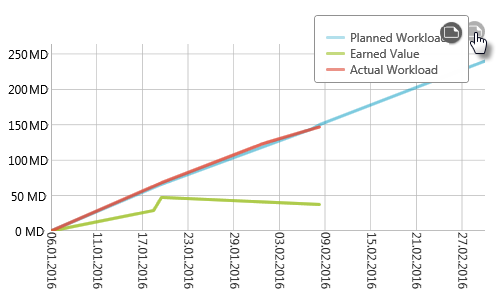
The x-axis shows the duration of the activity. All efforts of the scheduled requirements are summed up and displayed in person days on the y-axis.
The blue line shows the planned effort and serves as a guideline. You use it as a guide and read whether you are in the plan.
The red line stands for the actual effort and shows you how much user effort is required up to the current point in time.
The green line shows you how much of the planned requirements have already been completed at the current time.