The Block Diagram
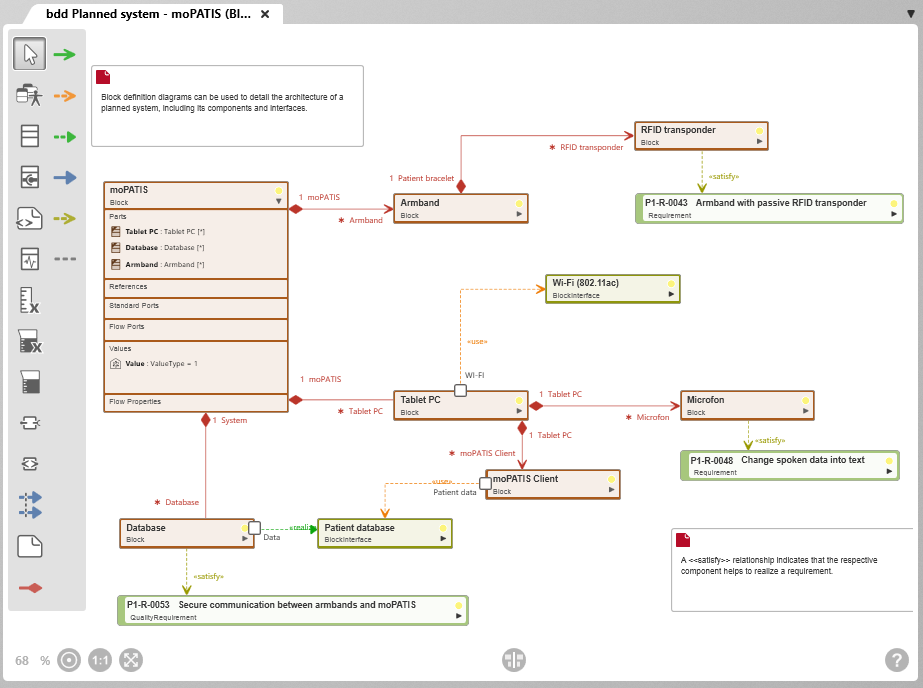
In a block definition diagram (short: block diagram), elements of OMG SysML™ (Systems Modeling Language) are used to model the hierarchies of and connections between the individual building blocks of a system. System components are modeled as blocks. In block definition diagrams, dependencies and relationships between blocks, their properties, values, composition and behavior are illustrated. Block diagrams are particularly useful for simply visualizing system function sequences and displaying relationships and connections between individual system components. The internal block diagram can be used to model how the properties and parts of a block interact.
The diagram can be opened:
- by double-clicking on the diagram
The diagram
The most important editing functions
| |
Add Existing Elements Enables integration of existing requirements or personas in the diagram. |
| |
Create Block Creates a system building block. A block visualizes a system building block for the description of logical and physical system components. In the collapsed view, the block symbol displays its name and its stereotype. The default stereotype is «Block». The expanded view also shows the properties:
|
| |
Create Interface Creates a new interface and adds it directly to the diagram. An interface specifies operations and signals that are used or realized by blocks. They are connected to the standard ports of a block by a realization or usage relationship. Their standard stereotype is “BlockInterface”. In the expanded state it additionally shows the contained elements. |
| Create region (version 7.3 and higher) Splits the diagram into areas of responsibility and groups blocks. The size of the region is determined by dragging with the mouse button pressed down. The default stereotype is “BlockDiagramLane“. Blocks that are located in a region are – if defined – in a package. If no Package is assigned to the region, blocks from different Packages can be dragged into a region. Regions cannot be nested. | |
| |
Create Standard Port Creates a standard port. Creates a standard port that defines the interaction point of a block. To create it, click on the symbol of a block. It specifies that a block requests or offers services. The type of port is specified by creating a realization or usage relationship to an interface. In the diagram, square boxes at the edge of a block symbol indicate a standard port. |
| |
Create Flow Port Creates a flow port. A flow port defines an interface through which it is possible to exchange objects, data , energy, etc. between blocks and their parts. There are atomic or non-atomic flow ports.
|
| |
Create Flow Specification Creates a new flow specification and adds it directly to the diagram. The flow specification defines the incoming and outgoing data, object and energy flows through a flow port in the form of flow properties. Incoming flows are shown with the keyword in, outgoing data with out, flows in both directions are shown with inout. In the block diagram, the collapsed view of a flow specification displays its name and its stereotype. The default stereotype of a flow specification is «FlowSpecification». The expanded view additionally shows the defined flow properties such as flow direction and type. Use the small triangle to switch between the collapsed and expanded views. |
| |
Create Signal Creates a new signal and adds it directly to the diagram. A signal defines a message which is comprised of a set of attributes representing the contents of the message. The collapsed view of an interface in a block diagram displays its name and default stereotype. The default stereotype is «Signal». The expanded view also shows the defined signal properties. Use the small triangle to switch between the collapsed and expanded views. |
| |
Create Generalization Links two blocks by a generalization. First click the generic block or generalization set and then the specialized block. A generalization visualizes a relationship between a generic and a specialized element. The specialized element inherits the properties and behavior of the generic element but also shows additional specialized properties and behavior. A generalization is indicated by a blue line with an arrow in the block diagram. The arrow points in the direction of the generic element. Generalizations can be modeled between the blocks, interfaces, value types and signals in block diagrams. |
| |
Create Generalization Set Creates a generalization set. Click on the symbol of a block to create it. Generalizations are grouped together in a generalization set. Generalization sets are named and provided with the Coverage and Overlap properties. They are displayed as square boxes with a blue triangle at the edge of the block symbol. |
| |
Create Aggregation Connects two blocks by a composition or an aggregation. First click the the aggregate block and then the interface. An aggregation is defined as a “consists of” relationship between an aggregate block and its block parts. The parts cannot exist without the whole. If the aggregate block is deleted, its block parts are deleted as well. A solid red line is used to indicate a aggregation. The red line ends in a solid diamond at the side of the aggregate. At the end of the line indicating the aggregation, the multiplicity and role name are displayed. As long as the aggregation has not been set to be navigable, a block part contains a reference property which is entered under references in the block symbol. Navigability can be specified in the Properties dialog of the relationship symbol. Navigable aggregations have an arrow at the end of the line pointing to the block part. |
| |
Create Association An association represents a semantic relationship between two blocks. It is used to indicate references between blocks. Reference properties are created in a block and are typed within the block which is located opposite to it. In the block definition diagram, an association is drawn with a solid green line. Navigable associations have an arrow at the end of the line pointing to the referenced block. The multiplicity and role names are displayed at the end of the line. |
| |
Create Uses Relationship Connects a standard port with an interface. First click the the standard port and then the interface. A uses relationship is modeled between a block’s standard port and an interface. It expresses that the block requires the interface. This type of relationship is shown by a dashed orange line with an open arrowhead pointing to the interface. |
| |
Create Realizes Relationship Connects a standard port with an interface. First, click the the standard port and then the interface. A realize relationship is modeled between a block’s standard port and an interface. It expresses that the block realizes or provides the interface. This type of relationship is shown by a green dashed line with a closed arrowhead pointing to the interface. |
| |
Satisfy Relationship A satisfy relationship shows the block that fulfills a requirement. A satisfy relationship is indicated by a green dashed line that ends in an arrow pointing to the requirement. The default stereotype is «satisfy». |
| |
Create Note Used to create a note to provide additional information about the chart or chart element. |
| |
Create Note Relationship links a note to another chart element. |