The Goal Diagram
Goal diagrams show relationships, dependencies and conflicts between the goals of a system, as well as the intention and the weight which stakeholders have placed on the goals. Goal diagrams can increase the overall acceptance of a system by giving those involved a better understanding of the scope and goals that the system will have. They make it easier to assess the relevance of prospective goals and can be used as a possible starting point for the definition of requirements. The weight of goals as related to stakeholders makes it easier to prioritize goals.
The dialog can be opened:
- via the context menu of a package with Create diagram/ Goal Diagram
The diagram
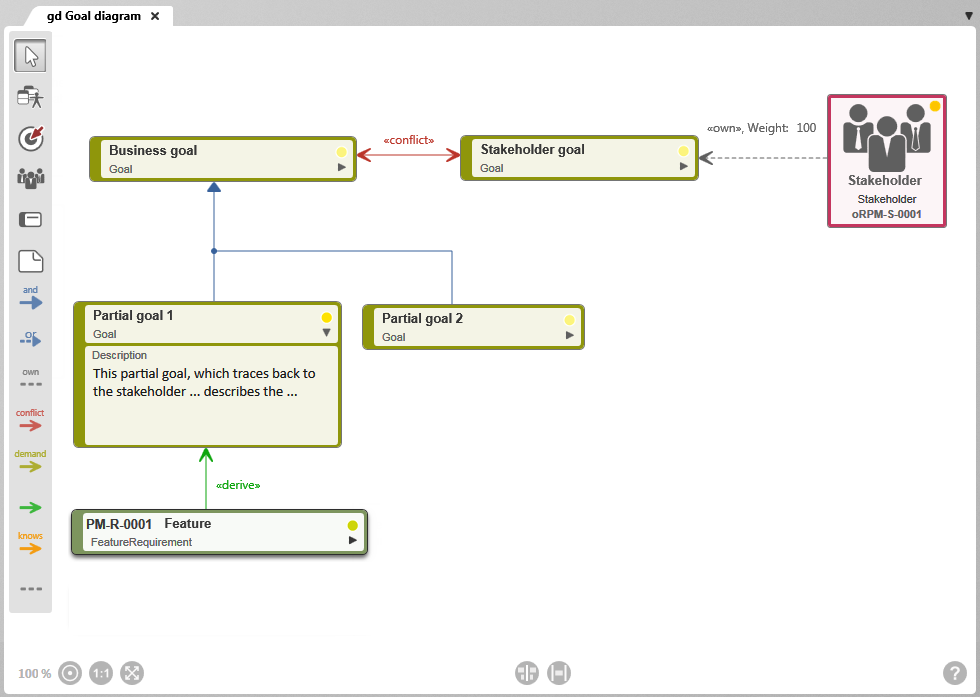
The most important editing functions
| Add Existing Elements Add existing goals and stakeholder requirements to the diagram. | |
| Create Requirement Create a new requirement and add it directly to the diagram. | |
| Create Stakeholder Create a new stakeholder and add it to the diagram. | |
| Create Goal Create a new goal and add it to the diagram. A goal is a characteristic feature of the system to be developed. The goal’s name and stereotype are displayed when it’s collapsed. Its standard stereotype is “Goal“. In the expanded state, the description of the goal is also displayed. You can use the small triangle to expand and collapse the symbol of a goal. | |
| Create Note Create a note to provide additional information about the chart or chart element. | |
|
Create Conflict Relationship Connect two goals with a conflict relationship. A conflict relationship illustrates a conflict between two goals. If one of the two goals is achieved, the other goal cannot be achieved. A conflict relationship is visualized as a solid red line with arrowheads pointing to each of the two competing goals. |
|
| Create Demand Relationship Connect two goals with a demand relationship. This relationship expresses that for one goal to be achieved, the other must also be achieved. Required relationships can be used to clarify the order or priority of goals. A demand relationship is visualized as a yellow solid line with an arrowhead pointing to the required goal. | |
| Create AND Relationship Connect two goals with an AND relationship. An AND relationship expresses that all subgoals must be met before the parent goal is met. And relationships are visualized in a blue solid line with an arrowhead. The arrowhead points to the parent target. | |
| Create OR Relationship Connect two goals with an OR relationship. An OR relationship expresses that at least one alternate goal must be met before the parent goal is met. Or relationships are represented by a dashed blue line with an arrowhead. The arrowhead points to the parent goal. | |
| Create Own Relationship Connect a stakeholder to a goal with an own relationship. This relationship shows that the stakeholder can benefit from achieving the goal. An ownership relationship is represented by a grey dashed line. | |
| Create Derive Relationship Connect a goal to a requirement with a derive relationship. This relationship shows that a requirement was derived from a target. A derive relationship is represented by a solid green line with an arrow. The arrowhead points to the target from which the request was derived. The default stereotype of this relationship type is «derive». | |
| Create Knows Relationship Connect two stakeholders together with a knowledge relationship. The relationship indicates the relationship between stakeholders. A knowledge relationship is represented by a solid orange line with an arrow. The standard stereotype of this relationship type is «knows». |